SocNav1 - A Dataset to Benchmark and Learn Social Navigation Conventions (version 1)
Contributors: Luis J. Manso, Pedro Nunez, Luis V. Calderita, Diego R. Faria and Pilar Bachiller
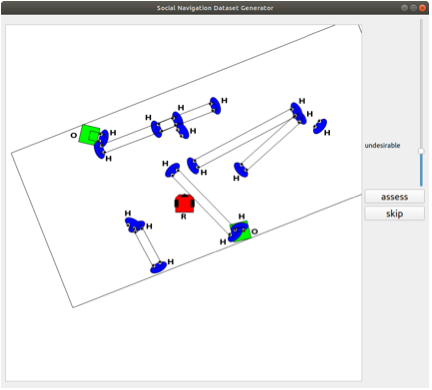
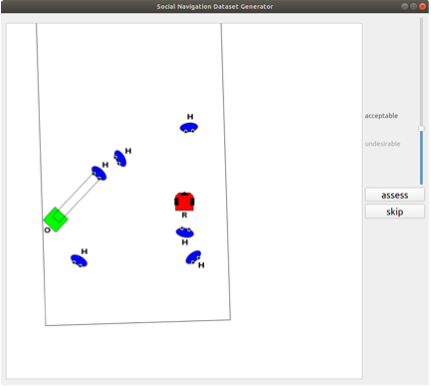
This dataset comprises single-frame scenarios depicting a room populated with humans, objects, and a robot, as illustrated in Fig. 1. Blue ellipses represent humans, green rectangles objects, and the red square denotes the robot. Two types of interactions are represented by black lines: human-human interactions (see Fig. 1 (left)) and human-object interactions (see Fig. 1 (right)).


Fig. 1 Scenario representation from the SocNav1 dataset. The 2D images depict blue ellipses for humans, green squares for objects, and a red square for the robot. Human-human and human-object interactions are represented by two parallel lines between the entities. The slider on the right is used to provide the discomfort score caused by the robot in the scenario.
Dataset generation
Three participants involved in the creation of the dataset assigned to each scenario a score between 0 and 100. A score close to 100 suggests that the robot is not causing any inconvenience to the individuals in the room, while a score close to 0 indicates an unwelcome situation or a collision with a human. The slider next to the scenario in Fig. 1 was used to determine the score when acquiring the dataset. To ensure the consistency of the three users labeling, both inter-rater and intra-rater agreement were quantitatively assessed using the linearly weighted kappa coefficient (J. Cohen).
The creation of SocNav1 was motivated by two key factors. Firstly, considering the current technology readiness level, the expected behavior from robots may differ from what is anticipated from interactions among humans. This divergence highlights the necessity to understand and align robot behavior with human expectations. Secondly, SocNav1 aims to evaluate the capacity of robots to gauge the discomfort their presence might evoke among humans. This ability holds significance for robot navigation systems as it aids in estimating path costs based on human comfort levels.
Citation
To cite this work, use the following BibTex notation:
@article{manso2020socnav1, title={Socnav1: A dataset to benchmark and learn social navigation conventions}, author={Manso, Luis J and Nu{\~n}ez, Pedro and Calderita, Luis V and Faria, Diego R and Bachiller, Pilar}, journal={Data}, volume={5}, number={1}, pages={7}, year={2020}, publisher={MDPI}}